400-660-8680


简化终端设备管�
全�管控PC计算机�智能手机以�平�电脑,确�网络安全
基于开æº�Apache Tomcatçš„Web应用æœ�务器——VMware vFabric tcæœ�务器,被越æ�¥è¶Šå¤šçš„用于构建现代的虚拟和云应用。它作为vFabric云应用平å�°çš„一部分,是一个è¿�行时æœ�务器。并且内置了Spring应用,已ç»�被很多用户使用。ManageEngine Applications Manager帮助用户监控vFabric tcæœ�务器和Spring应用的å�¯ç”¨æ€§å’Œæ€§èƒ½ï¼Œç¡®ä¿�和业务相关的云æœ�务平å�°æ£å¸¸è¿�行。
Applications Manager监控vFabric tc�务器的关键组件以检测��性能问题。出现问题时�时通知管�员,帮助分�性能瓶颈。
当和VMwareæœ�务器 and 云实例, t监控器组å�ˆåœ¨ä¸€èµ·çš„适å�ˆï¼Œtcæœ�åŠ¡å™¨ç›‘æŽ§å°±æ˜¾å¾—æ›´åŠ çš„é‡�è¦�了。
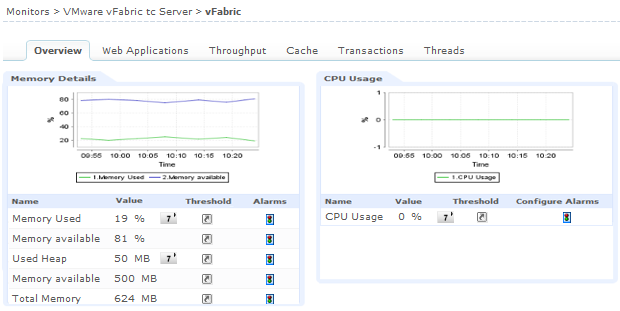
深入了解内å˜çš„使用情,在内å˜ä½¿ç”¨å®Œä¹‹å‰�通知æœ�务器。
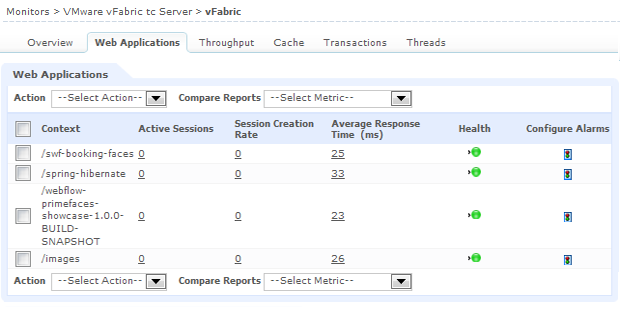
Identify the various applications running in the vFabric tc Server and their health status.You can also enable or disable the web application from within Applications Manager client itself.
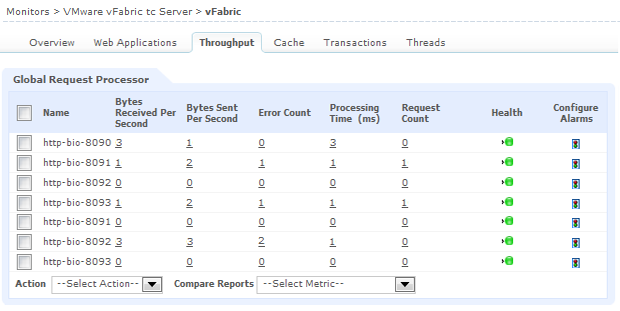
Get details on the requests received and sent per second in the server along with the counts for the request not processed, time taken to process the request, etc.
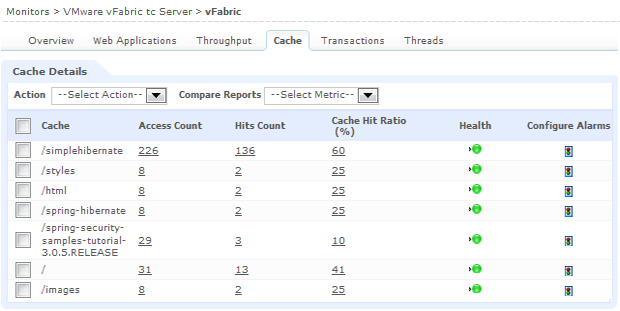
Monitor the cache hits of the applications and get notified when the hit counts or the cache hit ratio violates the threshold.
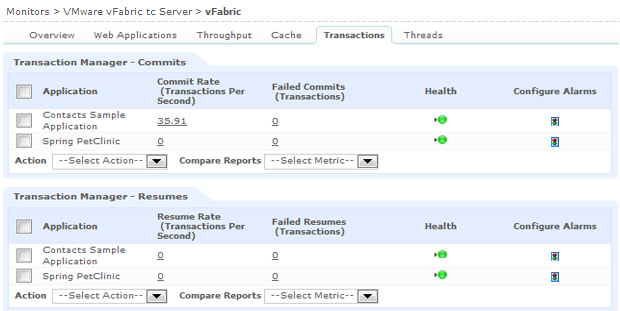
Monitor the transactions in the application level and get notified when the commits, rollback and suspend rates breach the threshold level.
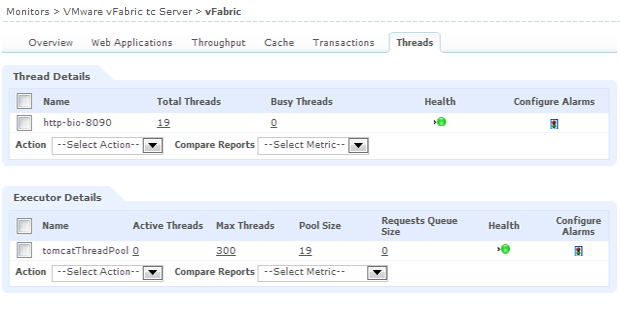
Know how the JVM is performing. Find out the total no. of thread count, no. of threads in the running state, threads that are waiting for a task and blocked threads in the JVM.